


Ireland’s planners, environmental consultants, local authorities, biological recorders, researchers, NGOs, private and public bodies, will be pleased to learn of the release of a major upgrade to the National Biodiversity Data Centre’s freely available online data portal Biodiversity Maps.
This new state-of-the-art system developed by the National Biodiversity Data Centre brings together more than 4 million records of almost 16,000 species to build the most comprehensive picture ever of what species occur where in Ireland.

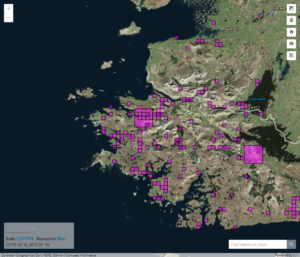
Biodiversity Maps is a national repository for the storage, display and dissemination of Ireland’s biodiversity data. As of March 2018, the record count within Biodiversity Maps stands at over four million verified and validated records of nearly 16,000 species. This large amount of publicly available data is a credit to those who have contributed over 140 datasets and to the large and growing body of biodiversity recorders in Ireland.
Since its establishment as Ireland’s primary and centralised data hub in 2008, Biodiversity Maps has undergone several major enhancements which have greatly improved the range of functionality available to users. Organisations and individuals have used Biodiversity Maps to manage, browse, map and report on a wide variety of datasets, surveys and species. This ease of access to such a wealth of data has proved invaluable in gaining an increased understanding of the state of Ireland’s biodiversity.
One of the core aims of the National Biodiversity Data Centre and its partners has been to build up a knowledge base on species distribution in Ireland and for this data to be made readily available for use in conservation management, planning and decision-making processes. Data on Ireland’s wildlife can be easily interrogated using Biodiversity Maps and is widely used to generate comprehensive reports on a locality’s biodiversity.
An important use case of Biodiversity Maps has been the ability to generate reports on the distribution of protected, threatened and invasive species in Ireland. Users may also generate reports on protected areas, such as Special Areas of Conservation and Specially Protected Areas, further adding to Biodiversity Maps’ merit as a valuable source of data for Appropriate Assessments required under the EU Habitats Directive.
When asked about what he envisioned for this new tool open for all data publishers and data users in Ireland and abroad, Liam Lysaght, Director of the National Biodiversity Data Centre, noted, ‘This new portal should be a game changer for the conservation of biological diversity in Ireland. This is a significant investment in Ireland’s biological information infrastructure and forms the basis of our most central mission, which is to assist the mainstreaming of biodiversity data and information into decision making, planning, conservation management and research. This core goal of the National Biodiversity Data Centre also happens to be the first objective of the National Biodiversity Action Plan 2017-2021 released by the Department last year which is to mainstream biodiversity into decision-making across all sectors. It would be great to see its use in informing public policy, planning and decision-making processes in general; it certainly provides an opportunity for local authorities to embed such information in local planning and development, including their local Biodiversity and Heritage Action Plans.’
In addition to being able to search by species, species are also grouped according to their policy relevance. Now data on 681 Protected, 972 Threatened and 425 Invasive Species can be accessed with a just click of a mouse, so planning for their needs should become easier. ‘In the same way that systems have been developed to assist the management of natural resources such as agriculture, forestry and fisheries, Biodiversity Maps now does the same for biodiversity’ Lysaght added.
One of the challenges faced in developing the system was to ensure that it would be suitable for the widest range of users. According to Barry O’Neill, I.T. and Data Manager, ‘A major consideration when developing the system was to deliver a greatly enhanced user interface and user experience in addition to extending the mapping and reporting functionality. With the release of this new technology we are confident that we have delivered a system that will be used by professionals to make their work more efficient, and to others who just want to find out more about their locality’. ‘One of the advantages of the new system is that we now have a piece of data infrastructure that can be fed through web services to users such as local authorities, to ensure they have the best available information when making decisions, for example, in relation to spatial planning.

In addition, should an NGO or any organisation or public body wish to incorporate elements of Biodiversity Mapsonto their websites, for example whether it is a set of statistics or a particular species distribution map, we can now provide that service’, he added.
Biodiversity Maps was developed by Compass Informatics, an information and location technologies company based in Dublin. The investment was provided by National Parks and Wildlife Service and the Heritage Council.
Biodiversity Maps can be accessed at https://maps.biodiversityireland.ie/


